The problem
Drought, bark beetles, windthrow and a rising fire risk are taking their toll on our forests. Conventional surveying reaches its limits: ground surveys are point-based, satellite data is coarse, and battery-powered multicopters spend most of their energy on hovering, which limits their time over the area. Foresters need current, area-wide and reliable data as a basis for their decisions.
The solution
A clear workflow — from the low-noise flight above the canopy to a reliable basis for decisions.
Low-noise flight directly above the canopy — high-resolution, georeferenced and with long endurance: more than 5 hours, measured with a 1 kg payload in economy operation.
AI-assisted analysis of the aerial data: damage areas, vitality and structures become visible.
Reliable maps and reports as a basis for forest planning and measure planning.
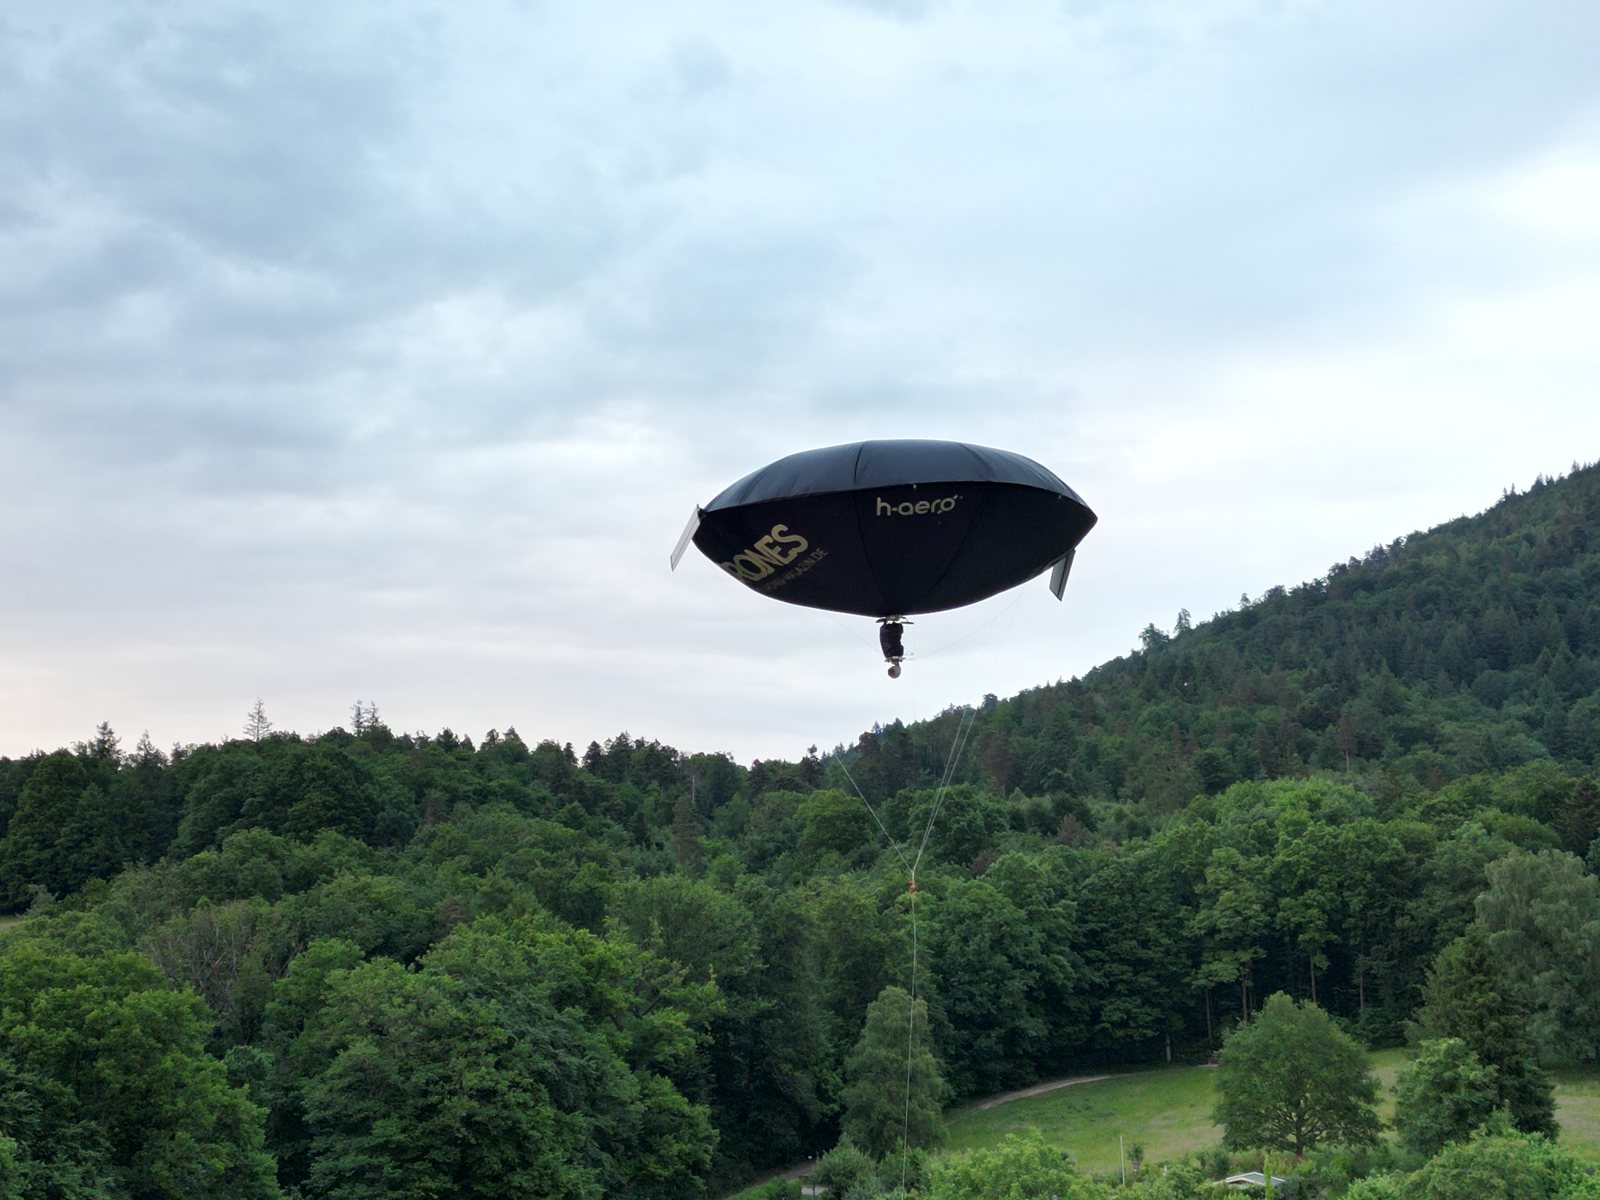
A multicopter spends most of its battery energy on hovering. With h-aero the helium carries the system and the energy is available to the sensor. More than 5 hours have been measured, with a light payload in economy operation.
No rotor downwash stirring up crowns, soil or sampled air, and a noise level below 40 dB — important in protected areas, for wildlife observation and for measurements close to the ground.
h-aero holds flight-ascent permits for operations over forest land and is active in the EU project FORWARDS (Horizon Europe) with its HALO-FARM sub-project (see the data chain).
HALO-FARM · EU project FORWARDS
HALO-FARM surveys five forest sites in Germany and Austria as free-balloon strips of 1 km × 10 km (5,000 ha, about 3,900 ha of forest). The satellite finds changes over large areas; h-aero delivers the close-up for expert interpretation. Six stations, shown here for site 1 near Baden-Baden — what already exists is marked real, what is scheduled is marked planned.
Demonstration — your changes are not saved. Turn a strip to see how its forest share changes.
Five sites: 1–3 near Baden-Baden, 4 near Dornbirn (Austria), 5 in the Rhön. Each site has a centre and a release direction chosen for the largest forest share. Tethered samples are taken inside the 1 km circle; for the survey the free balloon is released at the centre and drifts with the wind at constant altitude along a 1 km × 10 km strip. Flight altitude = strip maximum + 100 m (792 / 808 / 975 / 1,254 / 985 m a.s.l.). Site 1: strip 135° (SE), about 90 % forest, terrain from 270 to 683 m. Together the five strips cover 5,000 ha, about 3,900 ha of it forest (OpenStreetMap).
Sentinel-2 (Copernicus), one low-cloud scene per month over a 3 × 3 km window: 17 of 19 months usable. Right half: vegetation index (NDVI) of the forest; magenta marks forest whose NDVI dropped by at least 0.15 against the same month of the previous year (May–September only). The largest value — 1.4 ha inside the circle in August 2026 — is a candidate for a close-up, not a diagnosis: that is what stations 3–6 are for.
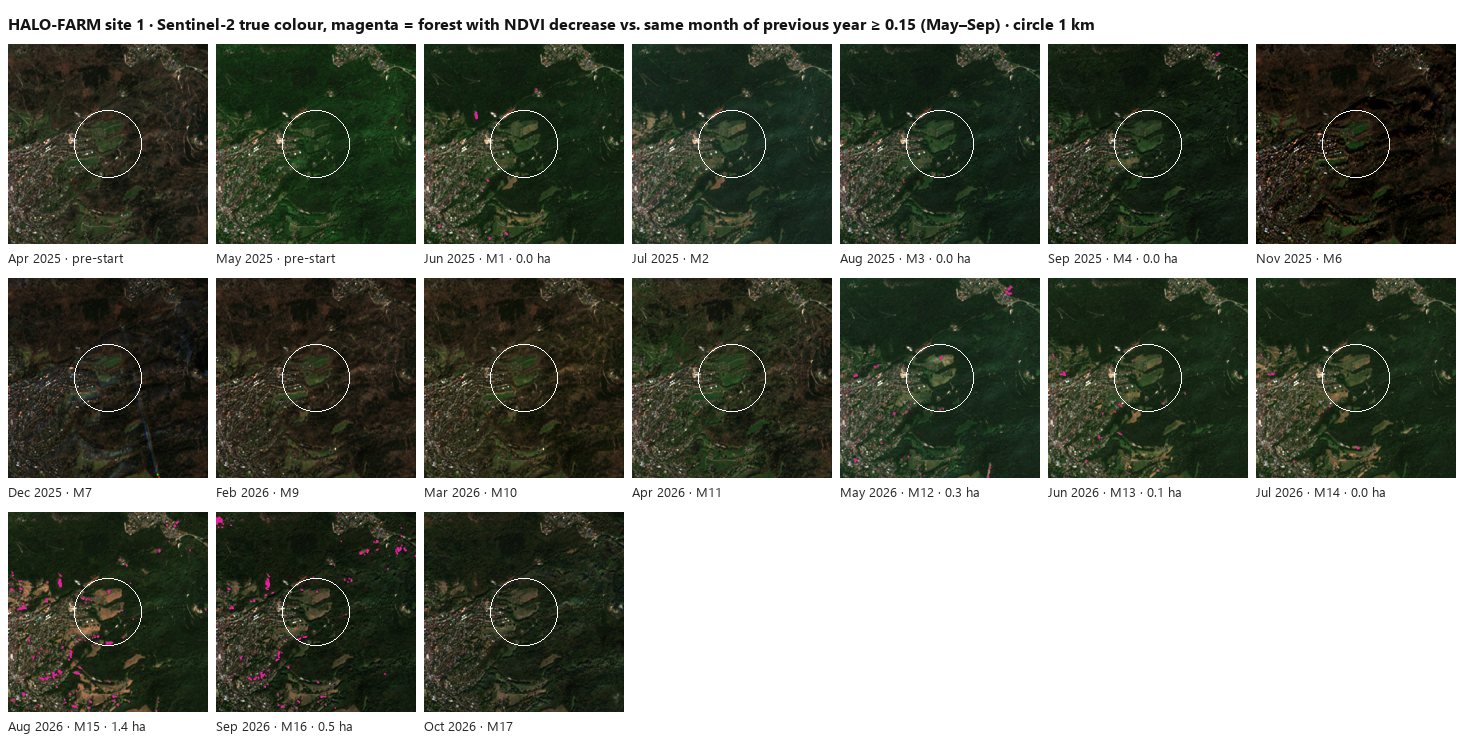
Prepared with our Open Hub satellite viewer data chain (viewer access on request). Data: Copernicus Sentinel-2 (ESA).
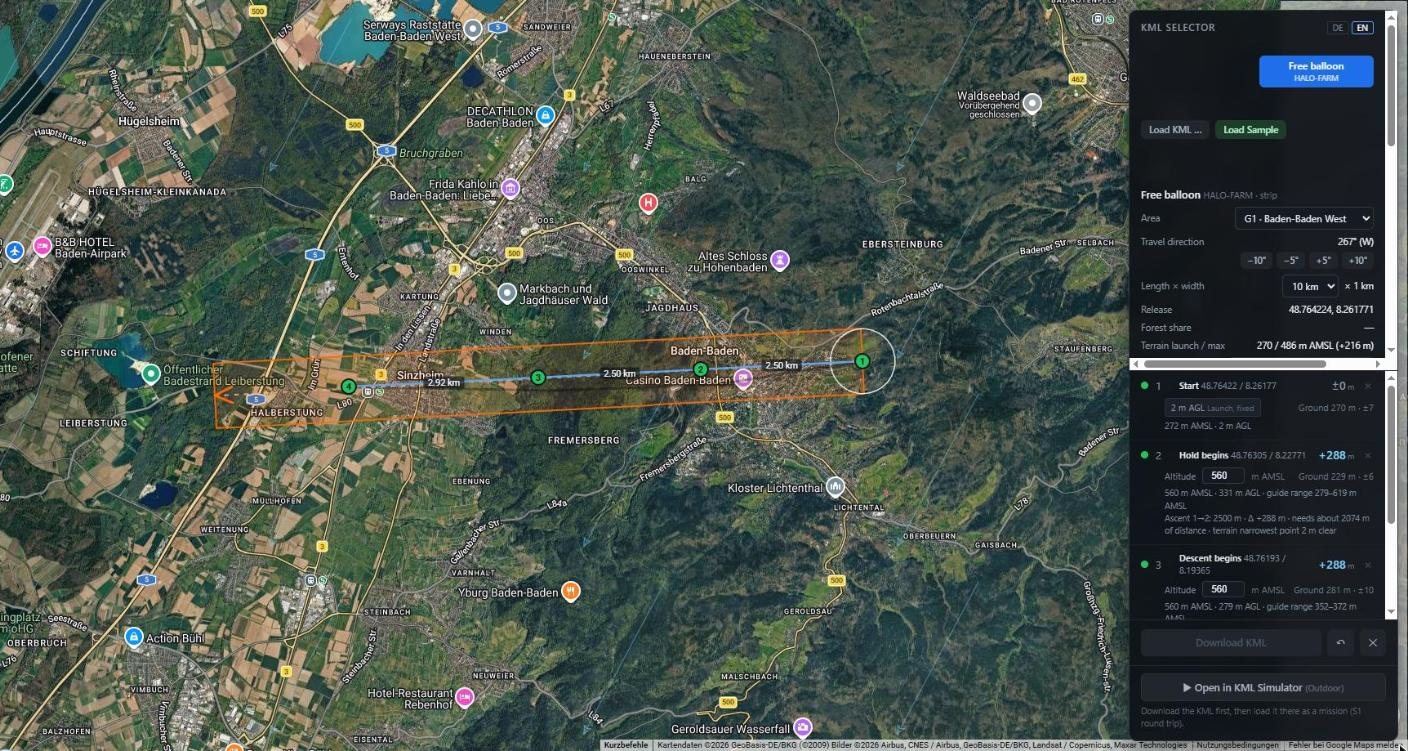
Our flight simulator checks each strip against terrain and wind forecast and optimises the free lift and the valve times so that the planned altitude profile is followed. Example for site 1 (planned flight on 1 November 2026, forecast wind): 7.7 of 7.9 km in 27 minutes, on average about 19 m from the planned altitude profile, 24 g of helium. The lateral offset of up to 1.4 km shows the wind turning with altitude — exactly what this step has to reveal before a campaign.
Free-balloon operation of the same platform was demonstrated in 2026 outside HALO-FARM. Over forest, the strips are flown from early November 2026 at site 1, followed by leaf-off (winter) and leaf-on (spring/summer) campaigns at all sites in 2027.
Detection methods are being developed on our own data. The examples show the direction of the analysis work, each with its origin.
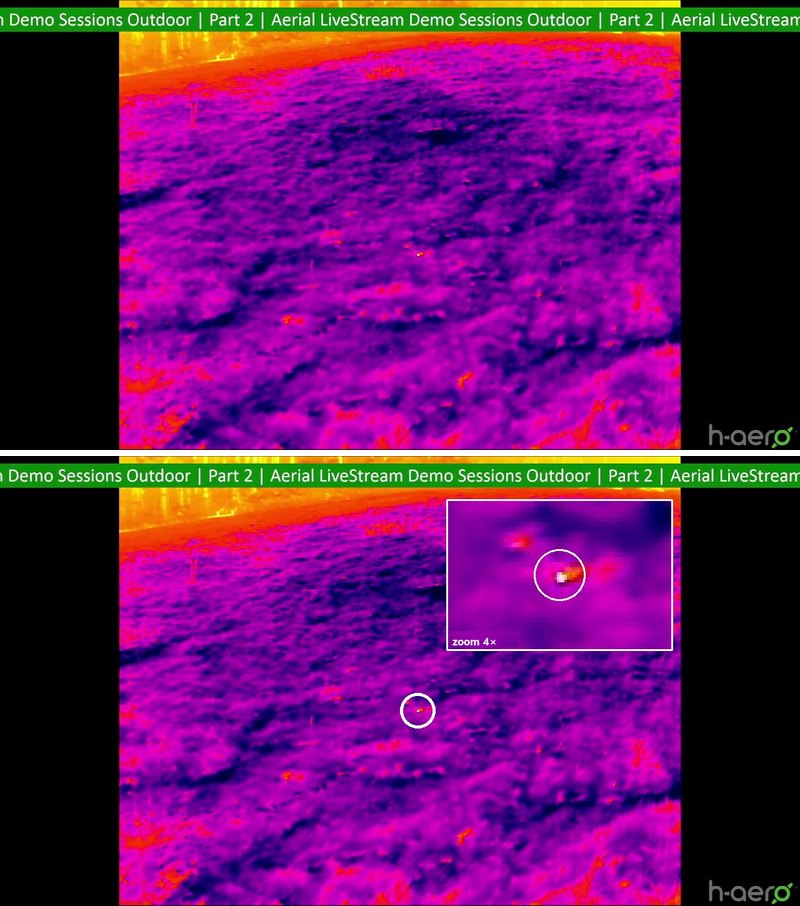
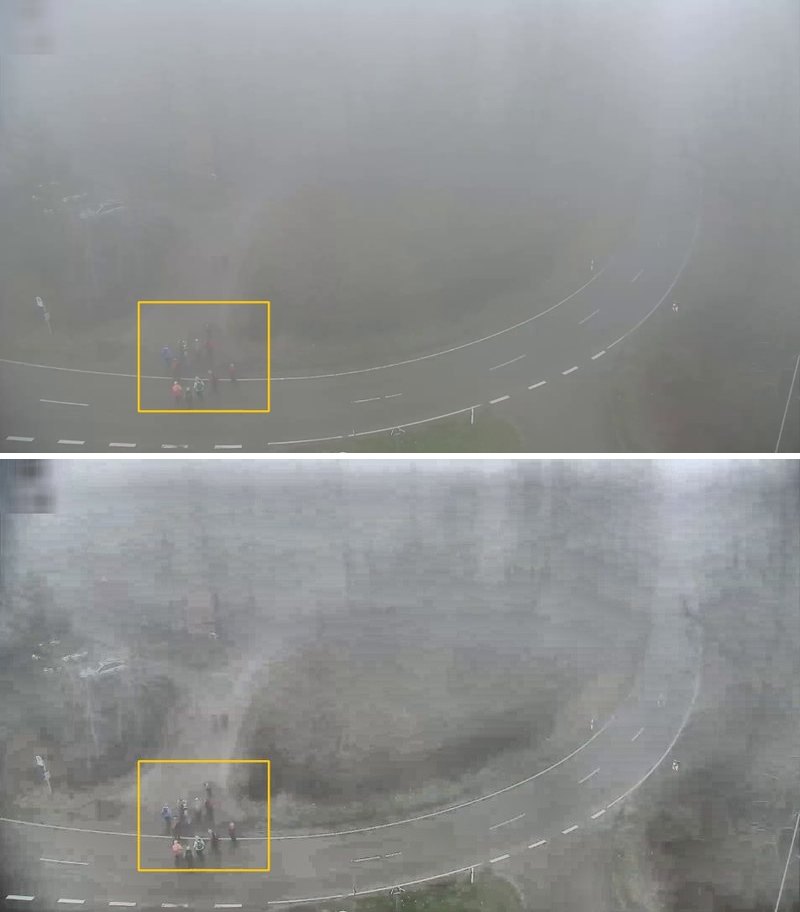
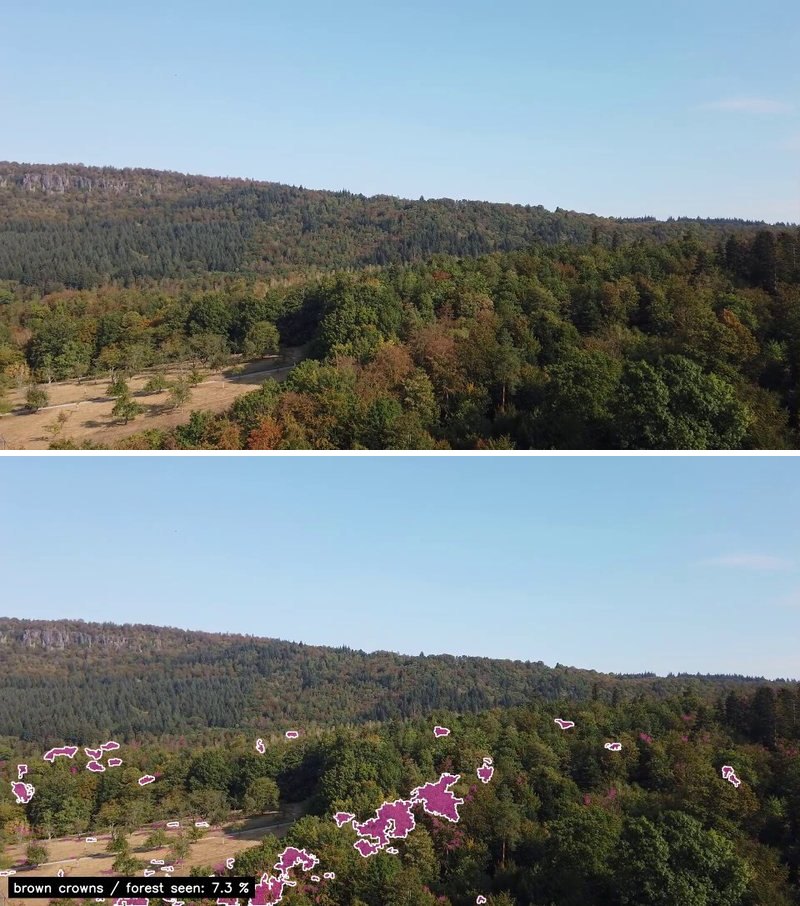
Status October 2026 (project month M17). Dates are given as recorded; material from before 3 June 2025 is marked as preparatory work.
Technology & sensors
The payload capacity is the shared budget for sensor and battery. The heaviest battery that still fits the budget next to the sensor gives the longest time over the area. We are happy to run the numbers for your scenario.
| h-aero® zero | h-aero® zero+ | h-aero® one | |
|---|---|---|---|
| Payload capacity (sensor and battery) | 500 g | 1,000 g | 3,000 g |
| Typical sensors | 4K camera | thermal camera | several sensors |
| Flight endurance | more than 2 h (design) | more than 5 h, measured with a 1 kg payload | more than 5 h (design) |
Flight endurance depends on the sensor's energy demand. The figures are maximum measured or design values with an economical payload, not typical values.
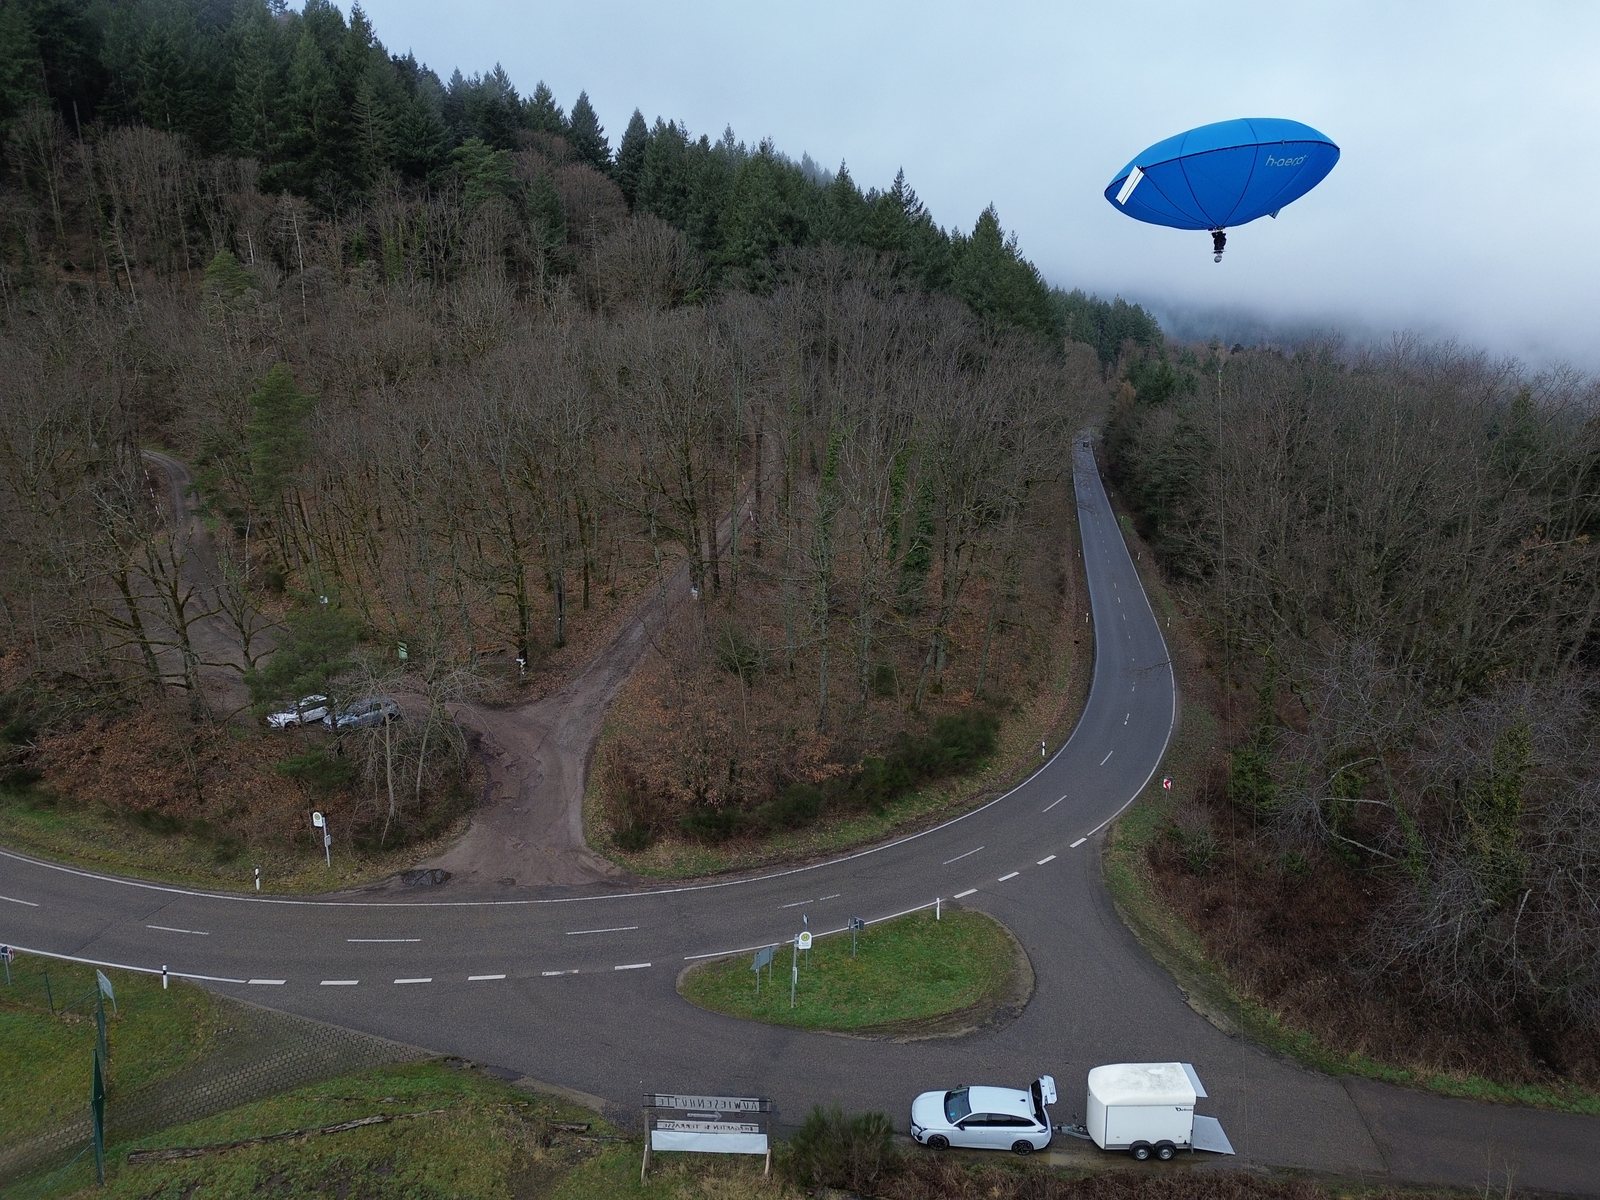
As a tethered balloon over an area, in Germany permit-free up to 30 m, above that with a flight-ascent permit. For keeping watch over an area, for example after a fire.
With its own propulsion over small areas, at low height and within sight of the platform. For samples and close-ups at a stand.
As an unmanned free balloon, covered by our flight-ascent permits, along a planned strip: the platform glides with the wind across the area and produces a continuous picture of the situation.
Like any balloon, the platform needs a weather window. In return it then stays over the area for hours. Which mode fits depends on the area, the question and the permit.
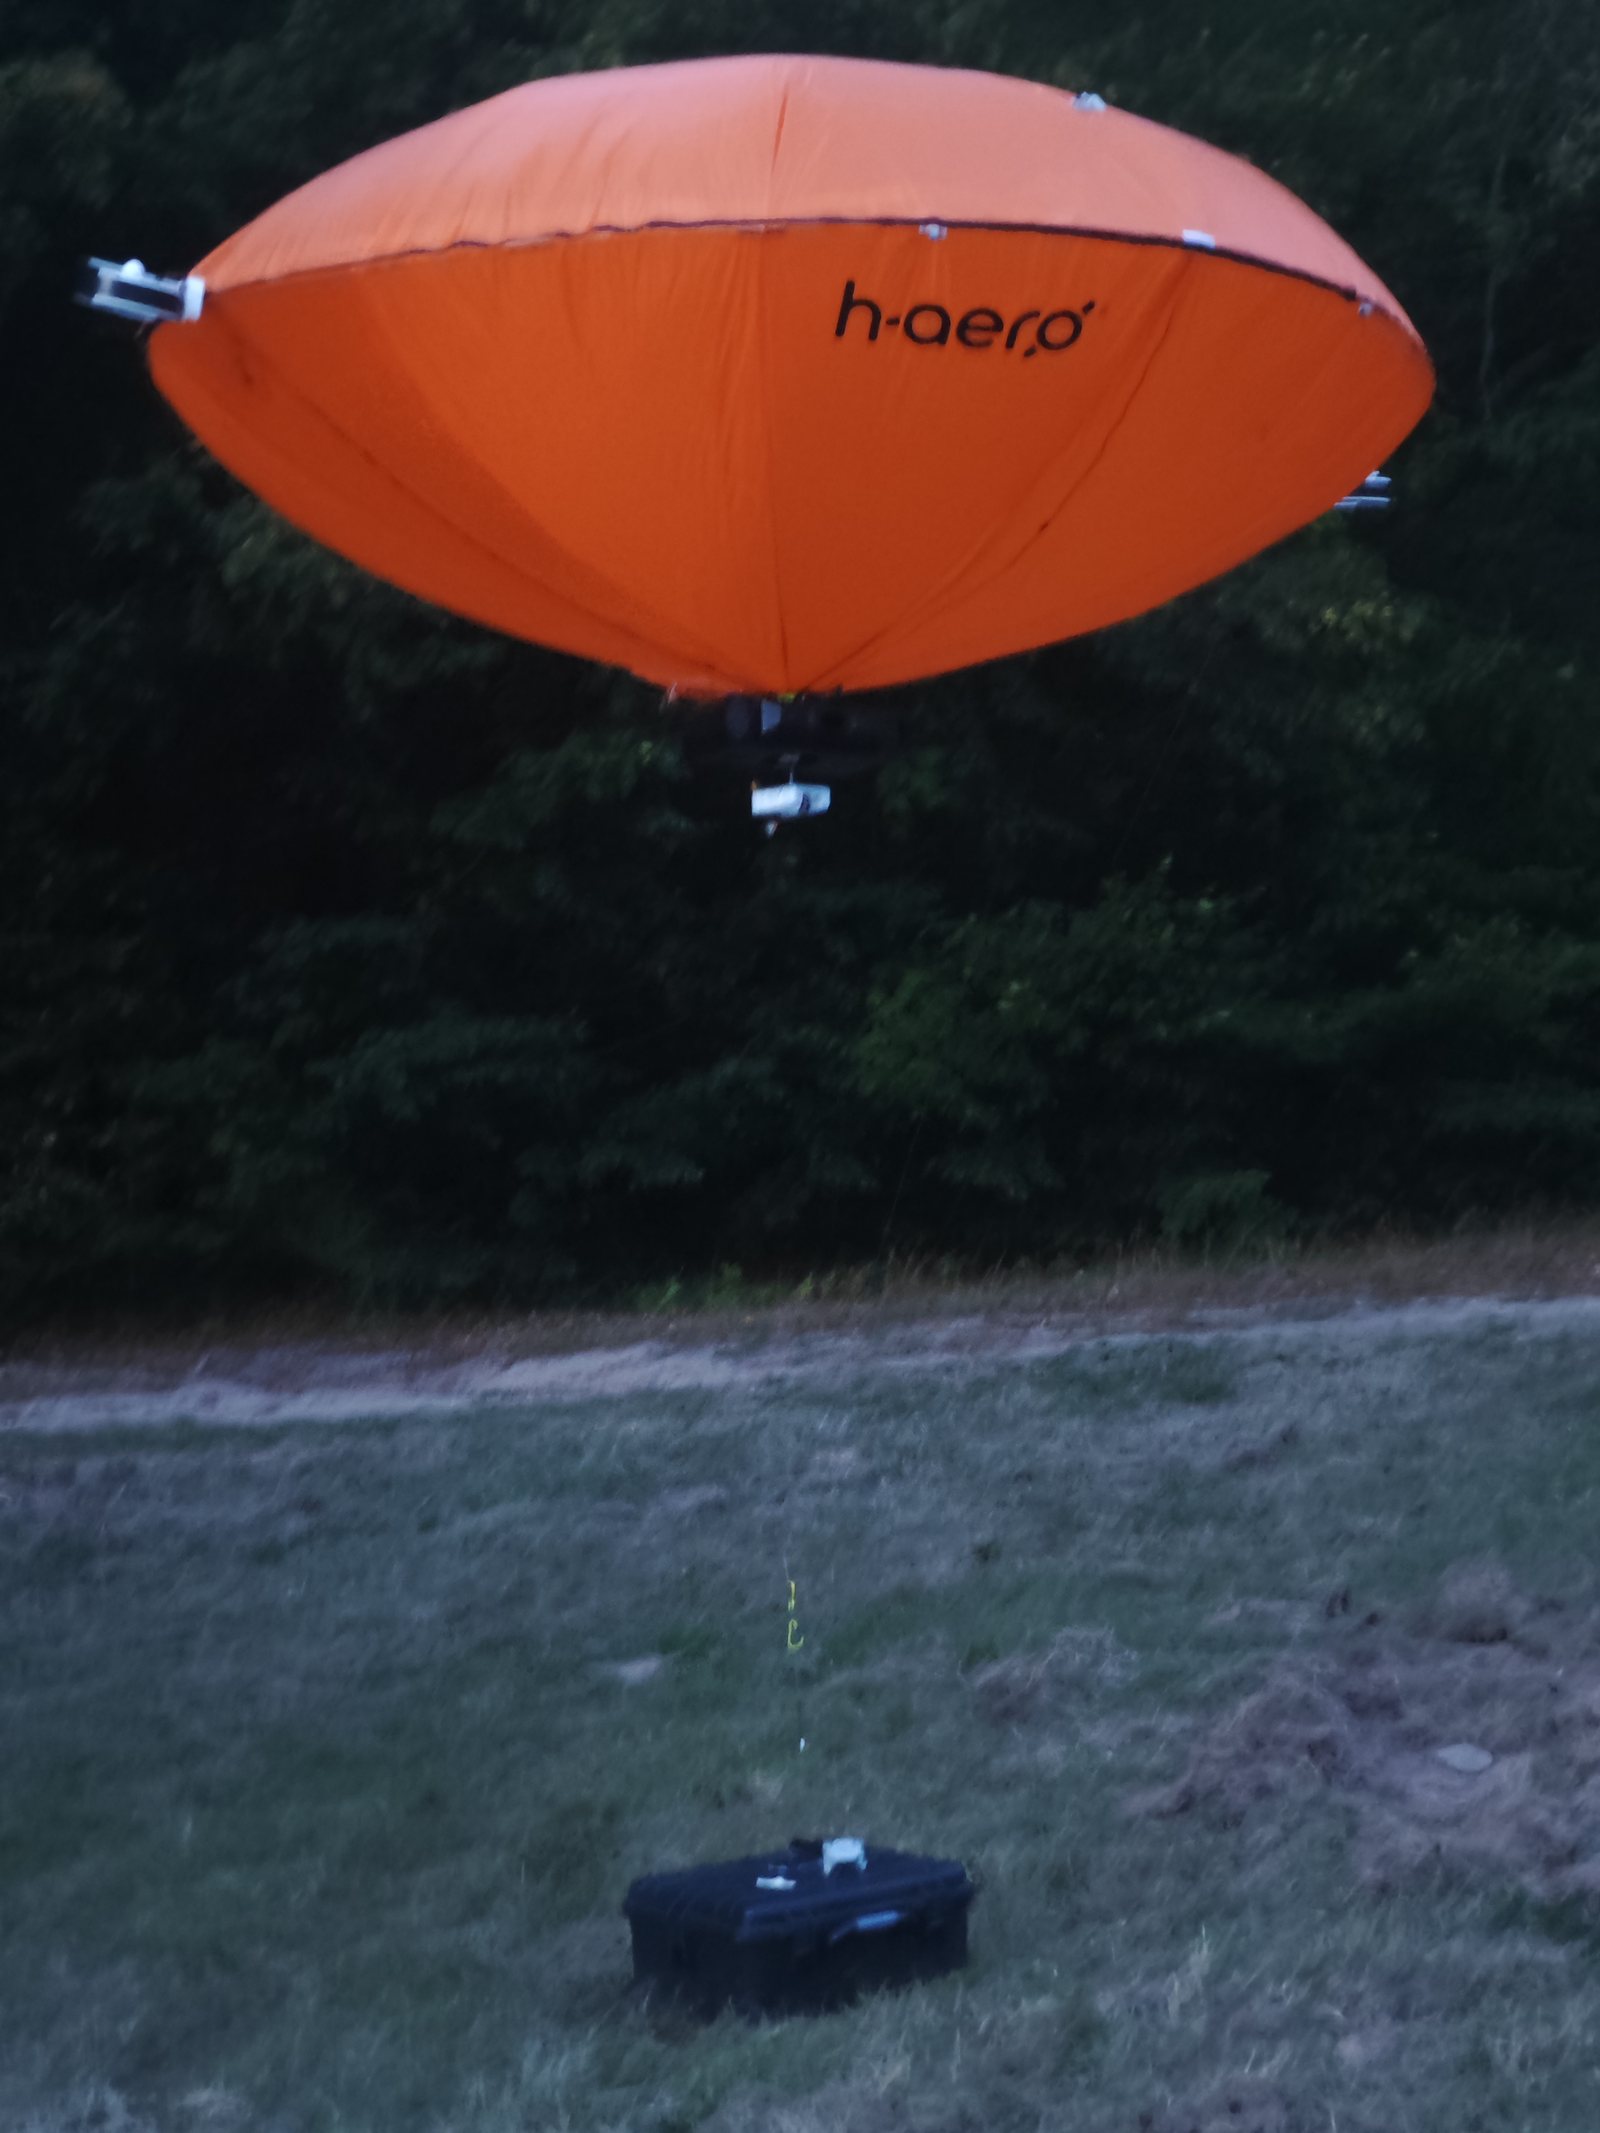
The platform is sensor-agnostic. These payloads have already been on board, some of them as our partners' instruments.
Interfaces: USB-C · LAN · Wi-Fi (5 GHz) · mobile network (LTE, 5G-capable) · SatCom. Noise level below 40 dB.
Applications
One platform, many fields of use — wherever area-wide, gentle capture is required.
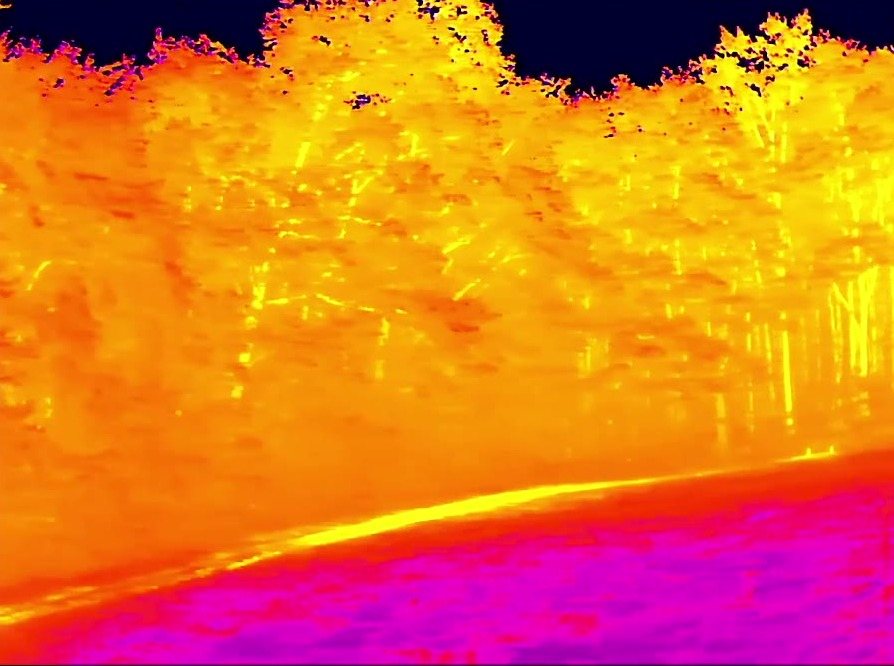
Where battery drones have to land after minutes, h-aero stays in the air: as a fire watch in high-risk conditions and, after the fire, as a watch over the area, on the tether and low-noise. The thermal camera on board reveals hotspots that cannot be seen from the ground.
Map infested areas (red- and grey-crowned trees). Early detection of green-attack stages is developed with partners in a pilot.
Seasonal and large-area capture of canopy condition.
Map damage areas and canopy gaps after storm events.
Thermal hotspot detection and persistent fire watch in high-risk areas.
Monitoring of burnt areas after extinguishing, until smouldering nests are out, with thermal imaging from the air.
Carbon inventory and taxation parameters of the forest inventory — captured from the air with 3D/LiDAR support.
Documentation and monitoring of calamity areas after afforestation and reforestation.
Inventory of the game population and monitoring of wildlife movement — low-noise and without startling wildlife.
Stationary use as an airborne base station — to improve positioning and radio coverage over the forest.
An added advantage in sensitive protected areas and national parks: low-noise, downwash-free operation that does not startle wildlife.
Deliverables
Foresters have worked with remote sensing for decades and know its limits. That is why we draw a clear line between what we deliver today with evidence and what emerges in a pilot project with specialist partners. All analyses follow forestry definitions and the data of the forest inventory.
Proven in our own operations
With specialist partners, checked against reference measurements on site
The benchmark for every pilot product: accuracy against the reference data, area output and cost compared with the survey on foot. We define the scenario together before the first flight.
Process
Next step
Get to know the platform at a free demo in Baden-Baden, or talk to us about a pilot flight over your forest areas.