The problem
Peatlands are the largest carbon stores on land. Drained peatlands release considerable amounts of CO₂, methane (CH₄) and nitrous oxide (N₂O). Restoration is effective climate protection — but its impact has to be proven. Peatlands are highly sensitive and hard to access: ground surveys are point-based and disturbing, and conventional drones startle the fauna.
The solution
A clear workflow — from the habitat-friendly flight to quantified restoration impact.
Low-noise LTA flight close above the peatland surface — habitat-friendly and georeferenced.
Greenhouse-gas laser sensors (CO₂, CH₄, N₂O) as payload — area-wide instead of point-based data.
Modeling and before-after comparison to quantify the restoration impact.
Low-noise and without rotor downwash onto the sensitive peatland vegetation.
A stable platform for highly sensitive laser-spectroscopy payloads.
Developed in a BMBF consortium with partners from laser sensing, peatland research and reference-data measurement — in the MoReNAT-Q research project (halfway point reached, field missions 2026).
Applications
Area-wide, gentle capture where conventional methods reach their limits.
Area-wide capture of CO₂, methane (CH₄) and nitrous oxide (N₂O) over the peatland surface.
Quantifying rewetting over time (before-after).
Complementing point-based eddy-covariance measurements with area-wide aerial data.
Assessing the climate impact of intact and restored peatlands.
Non-invasive capture of sensitive, hard-to-access wetlands.
Habitat-friendly, low-noise, no rotor downwash onto the peatland vegetation.
Process
In action
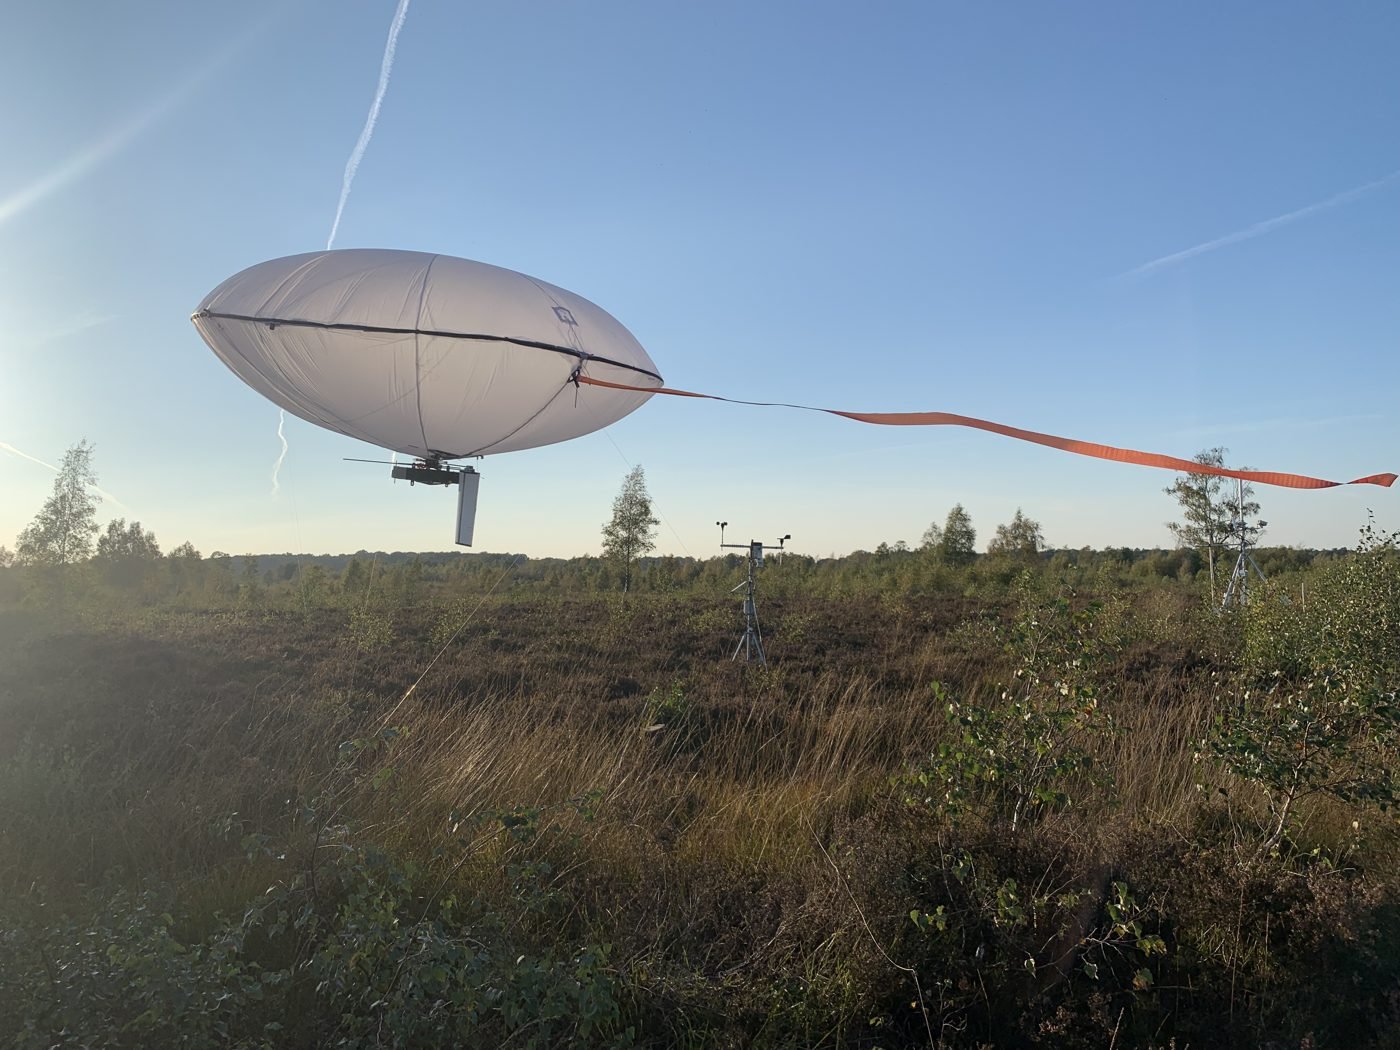
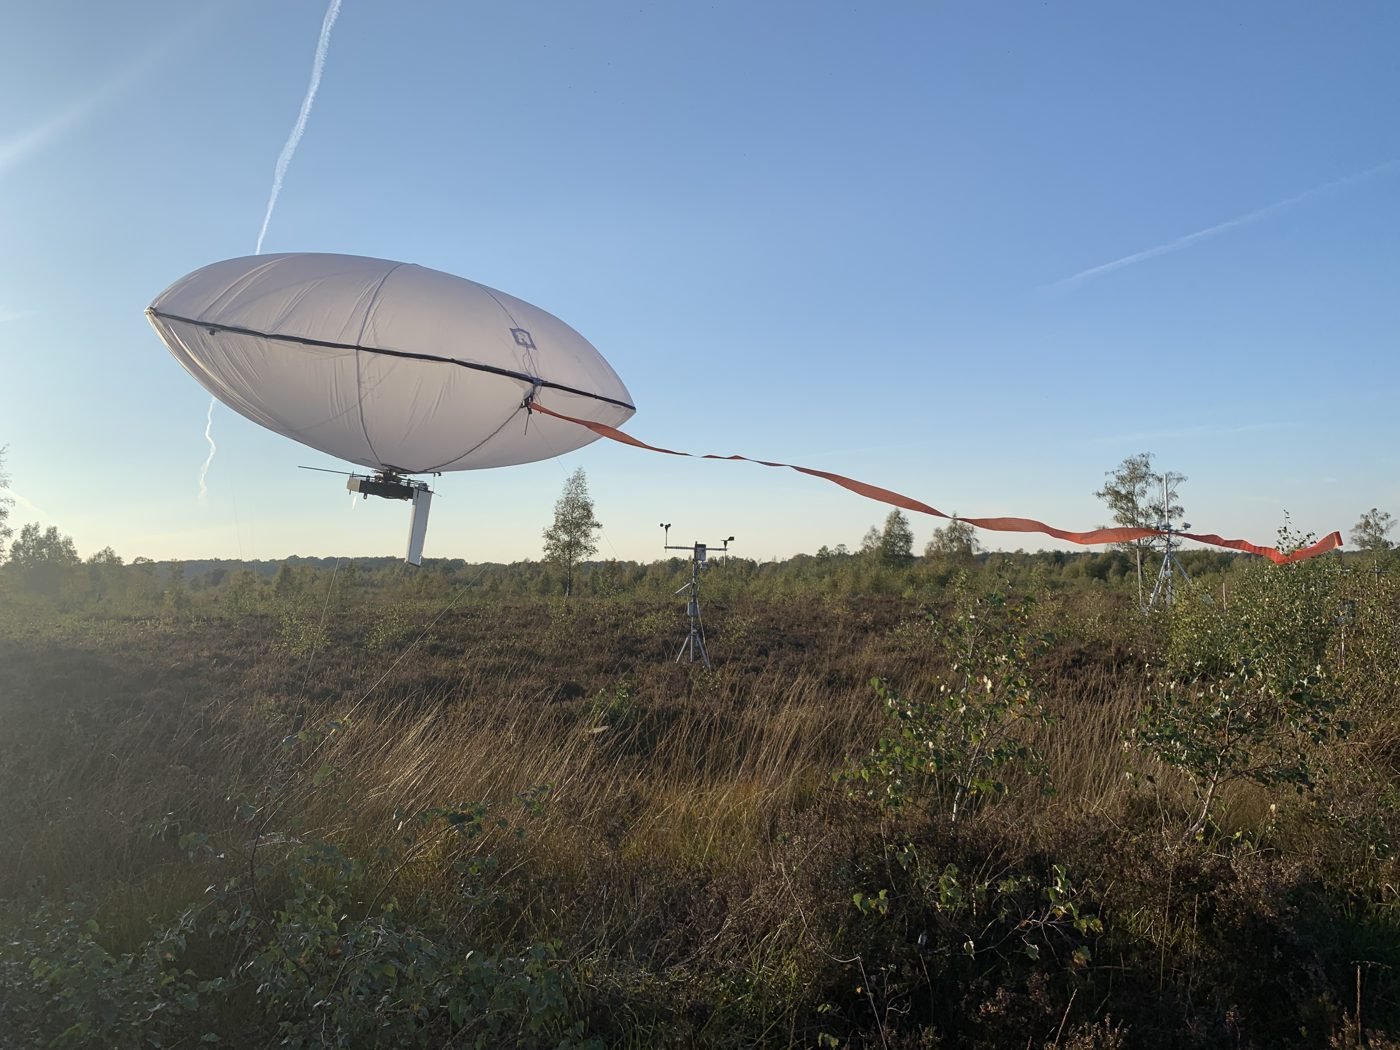
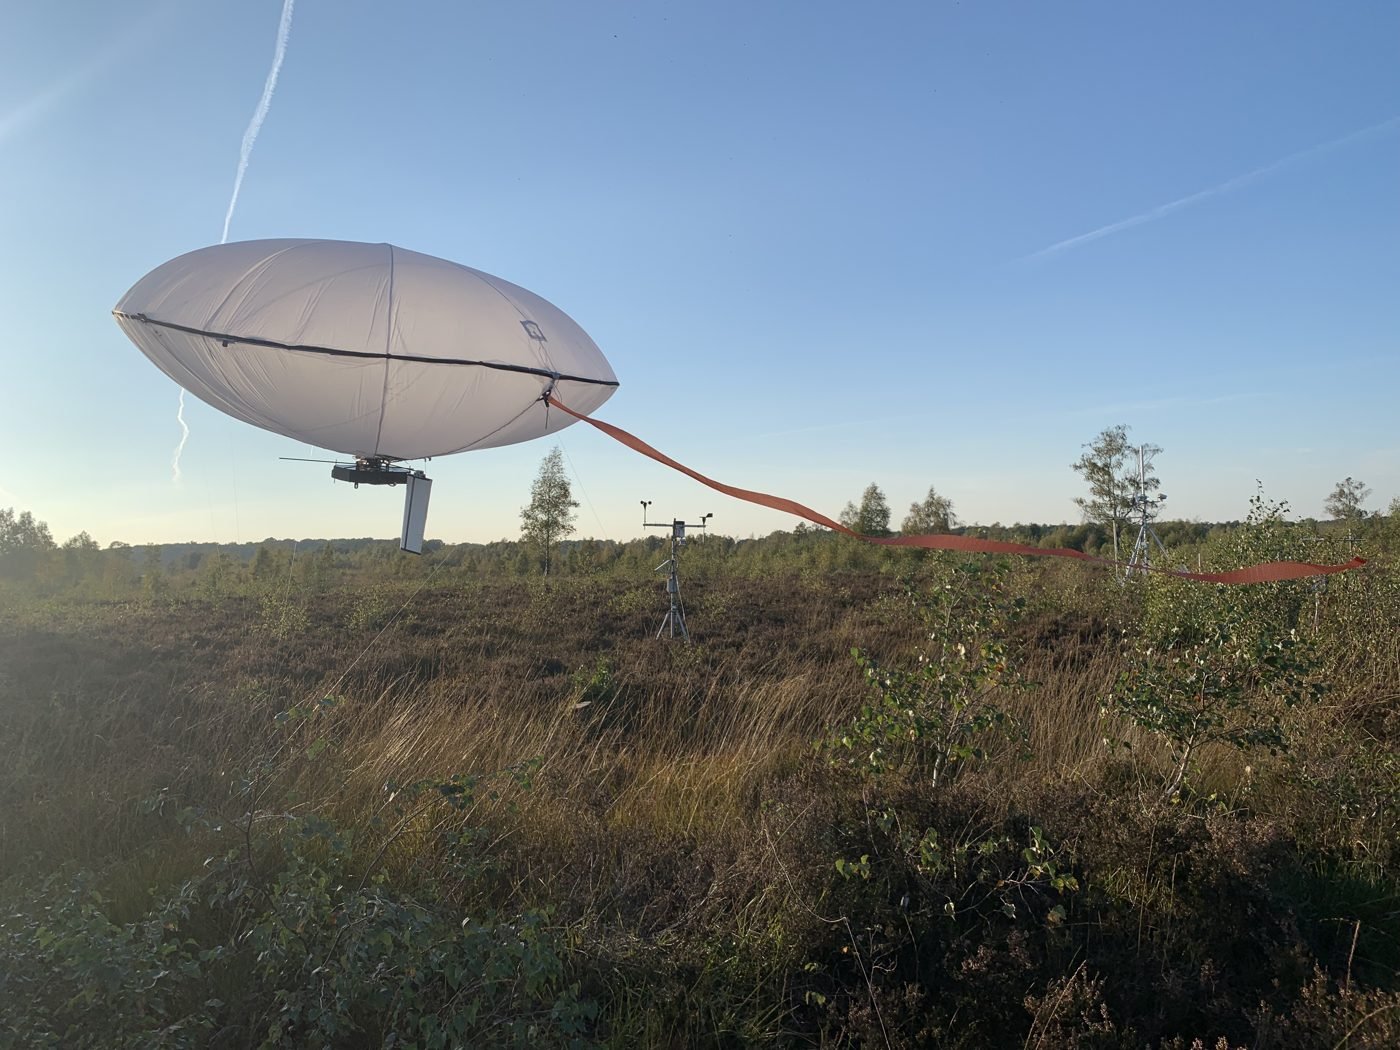
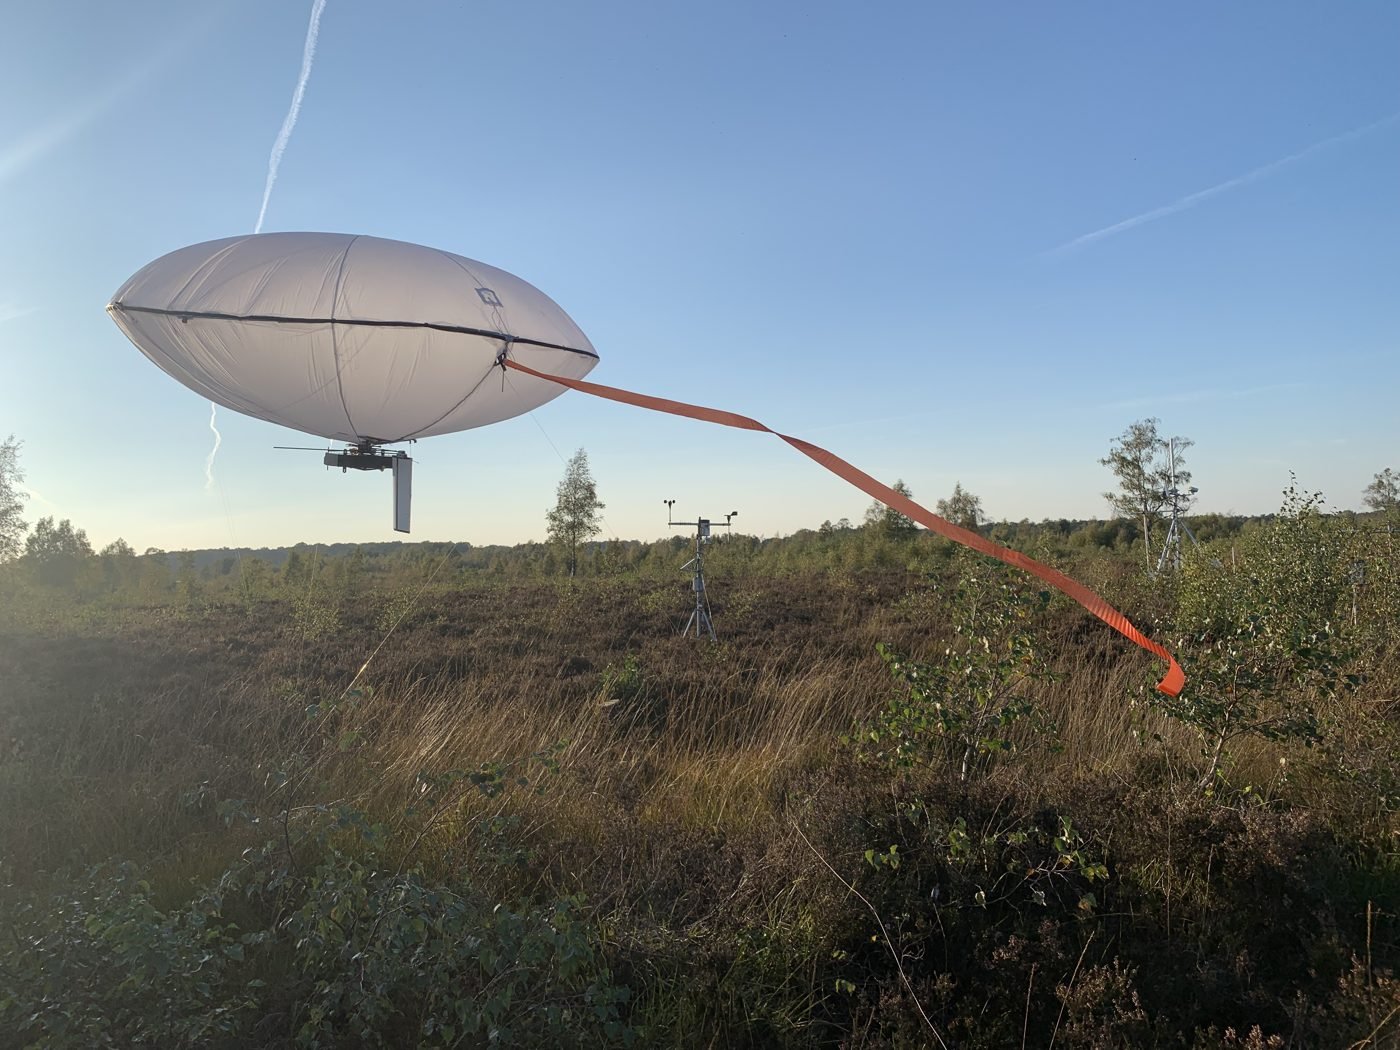
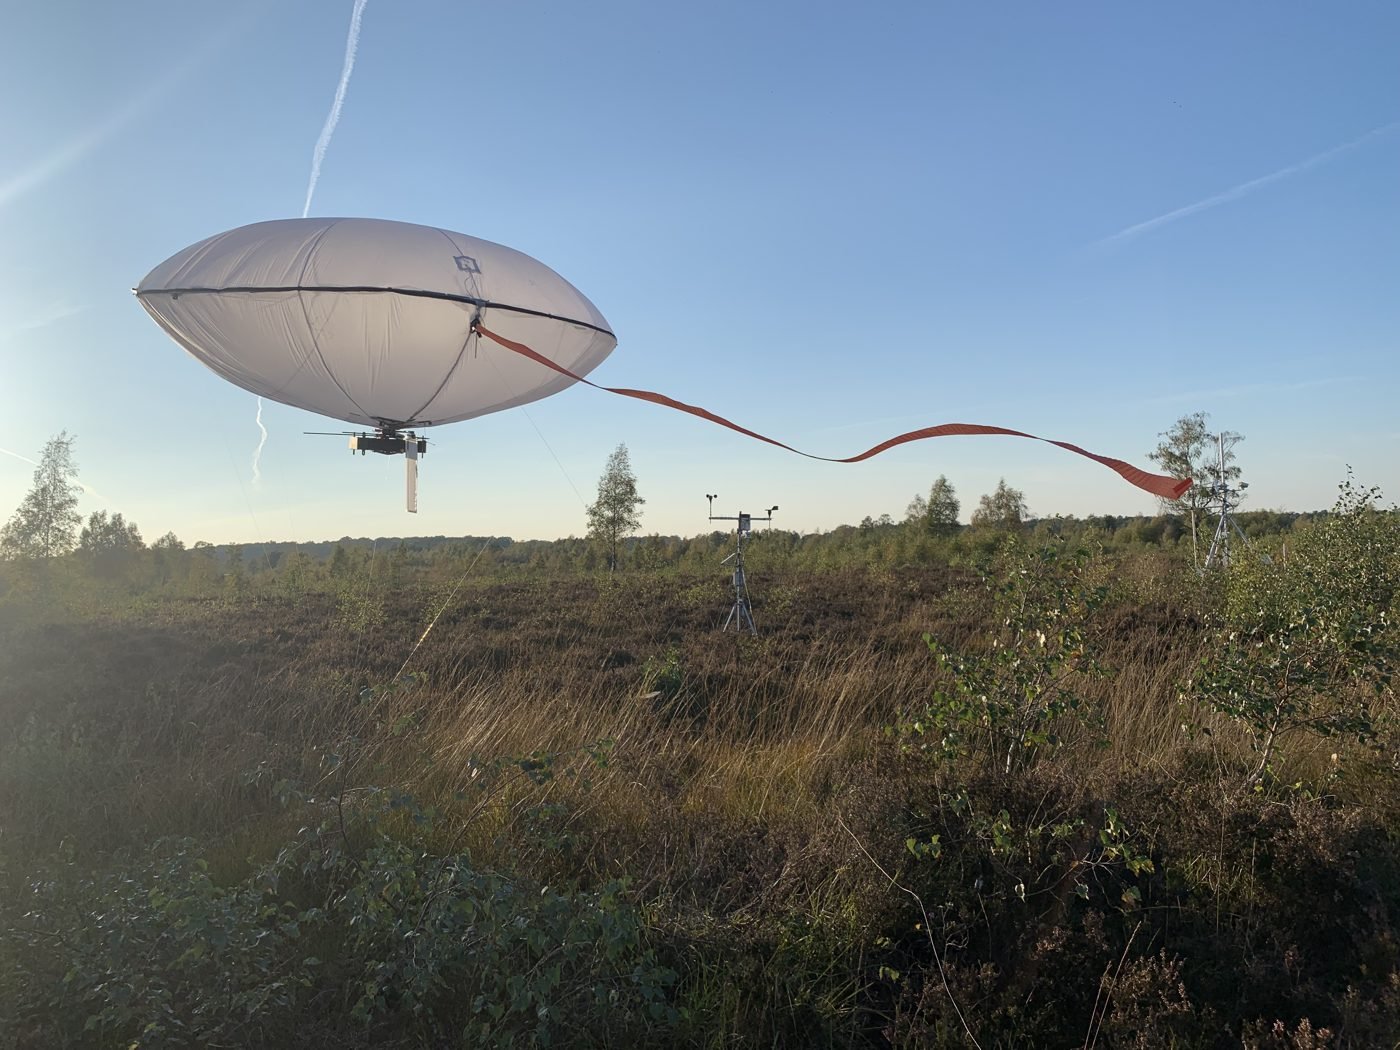
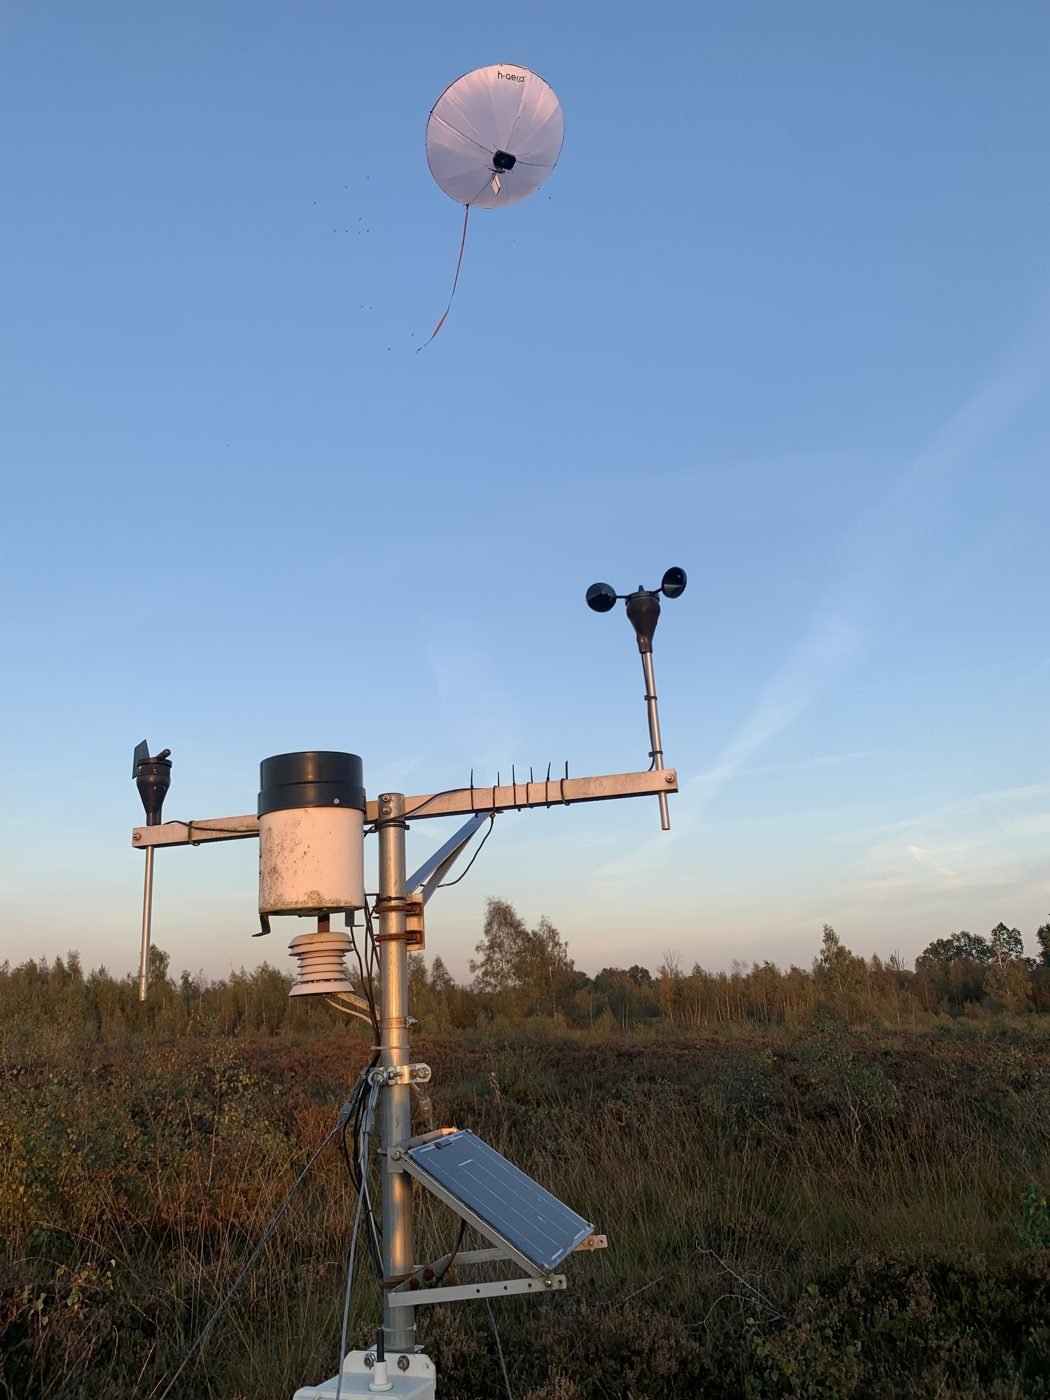
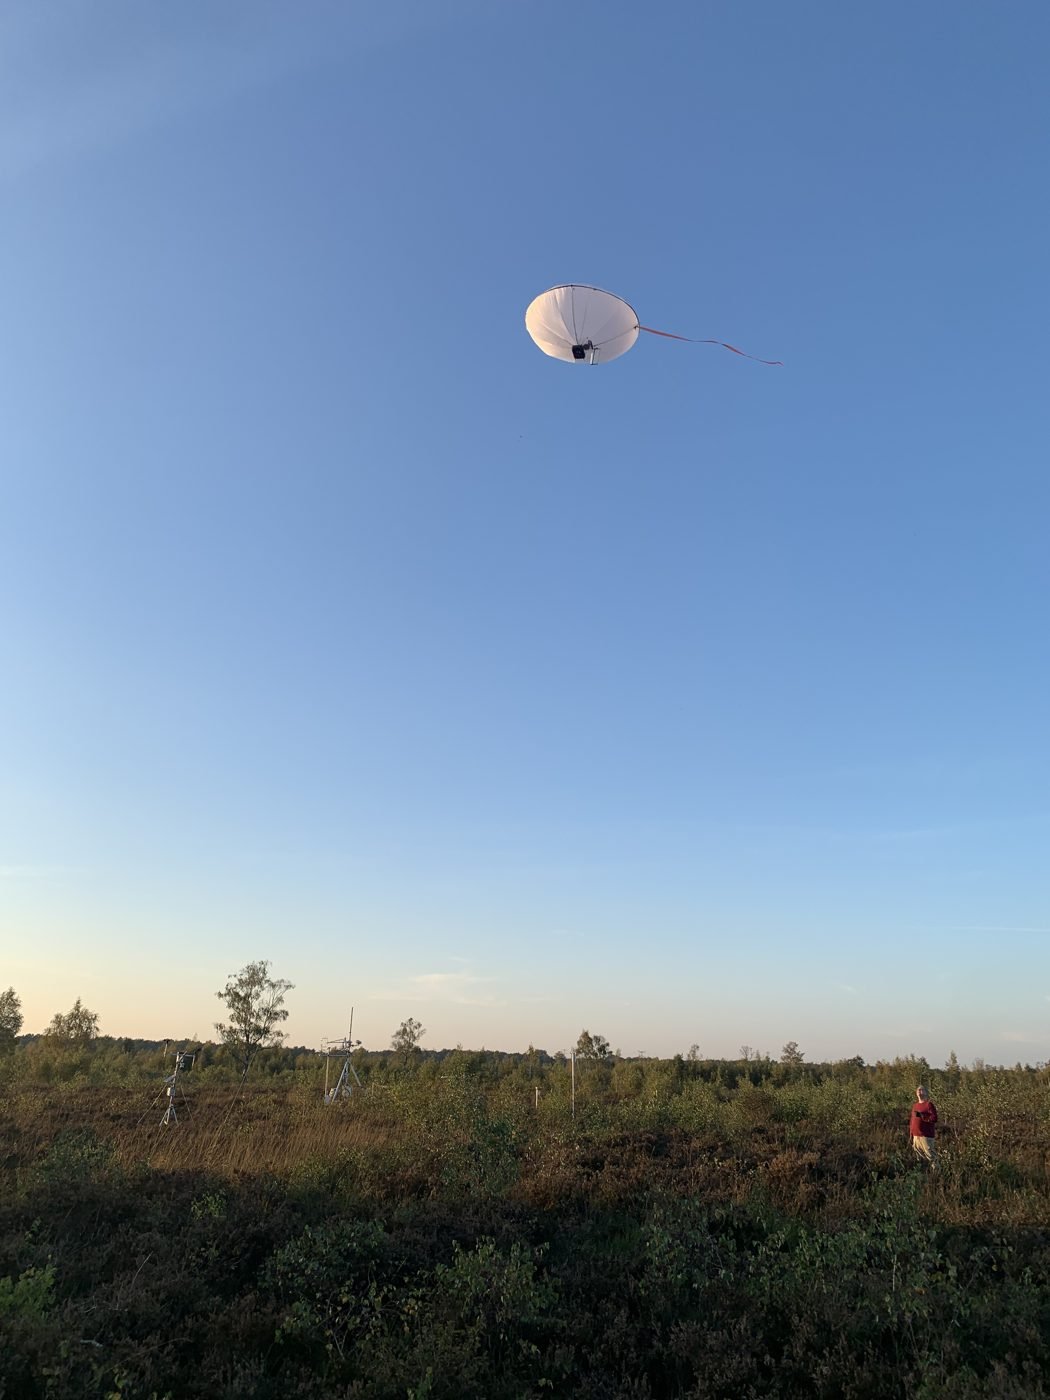
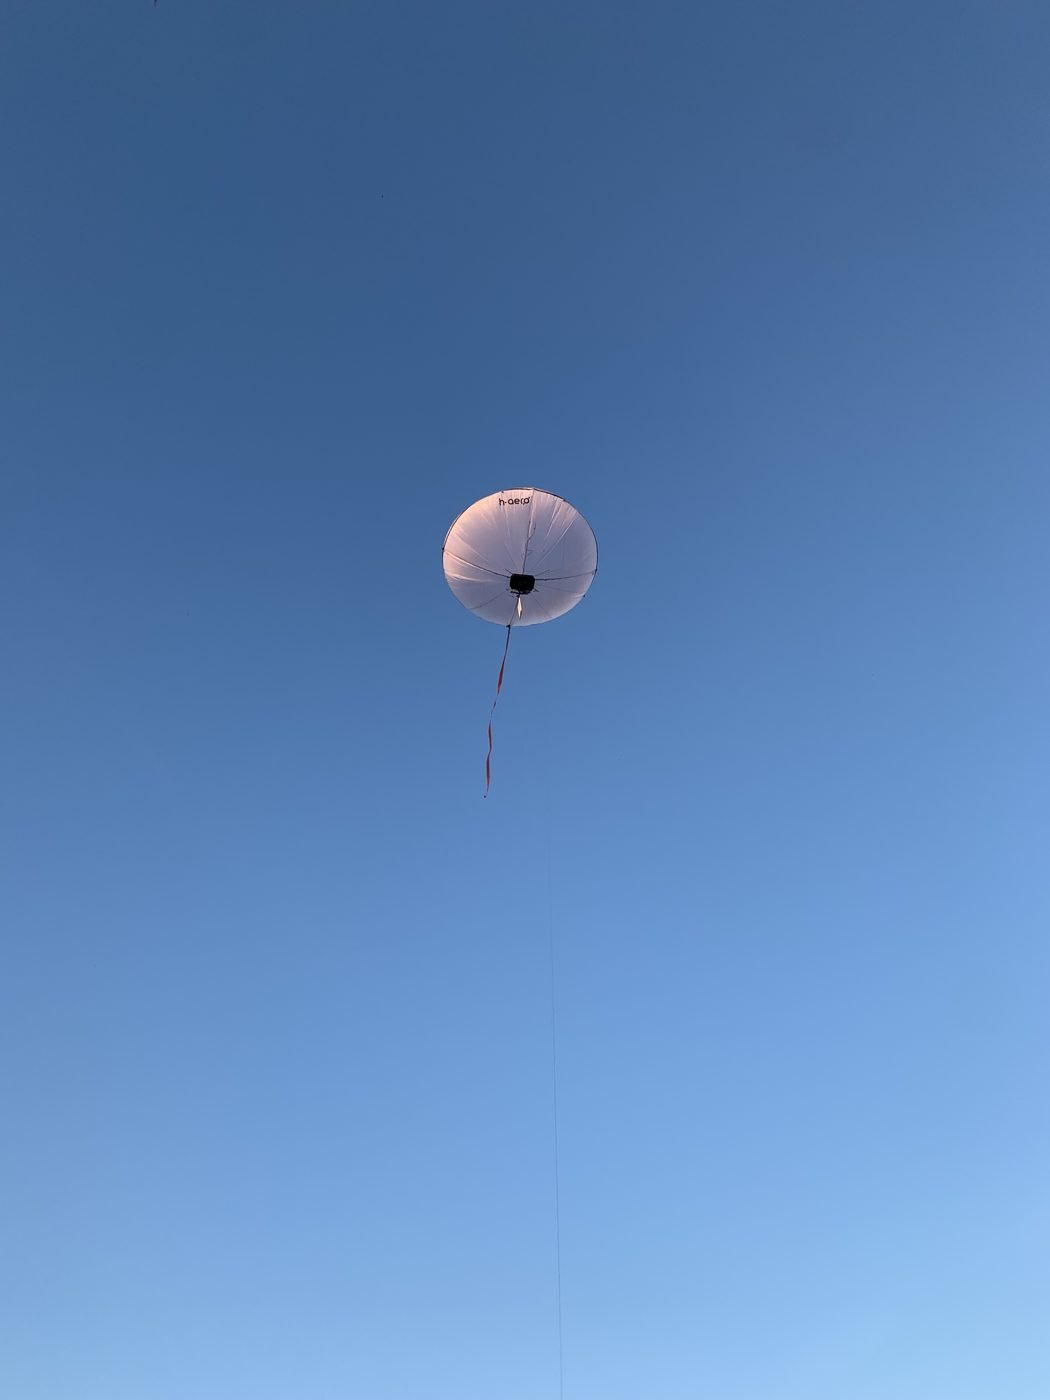
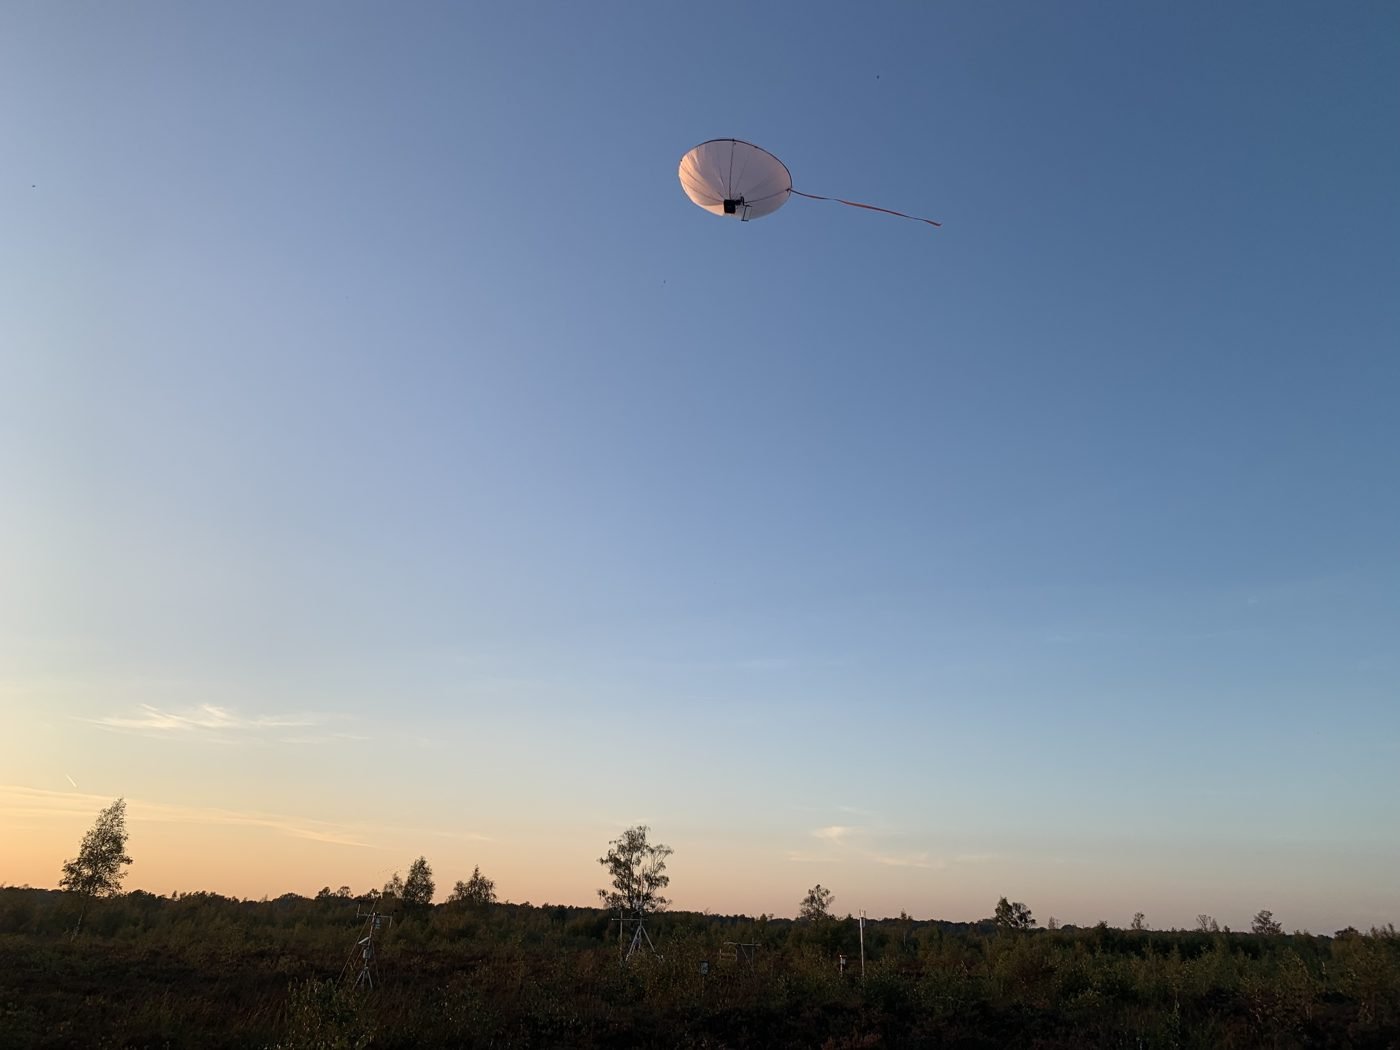
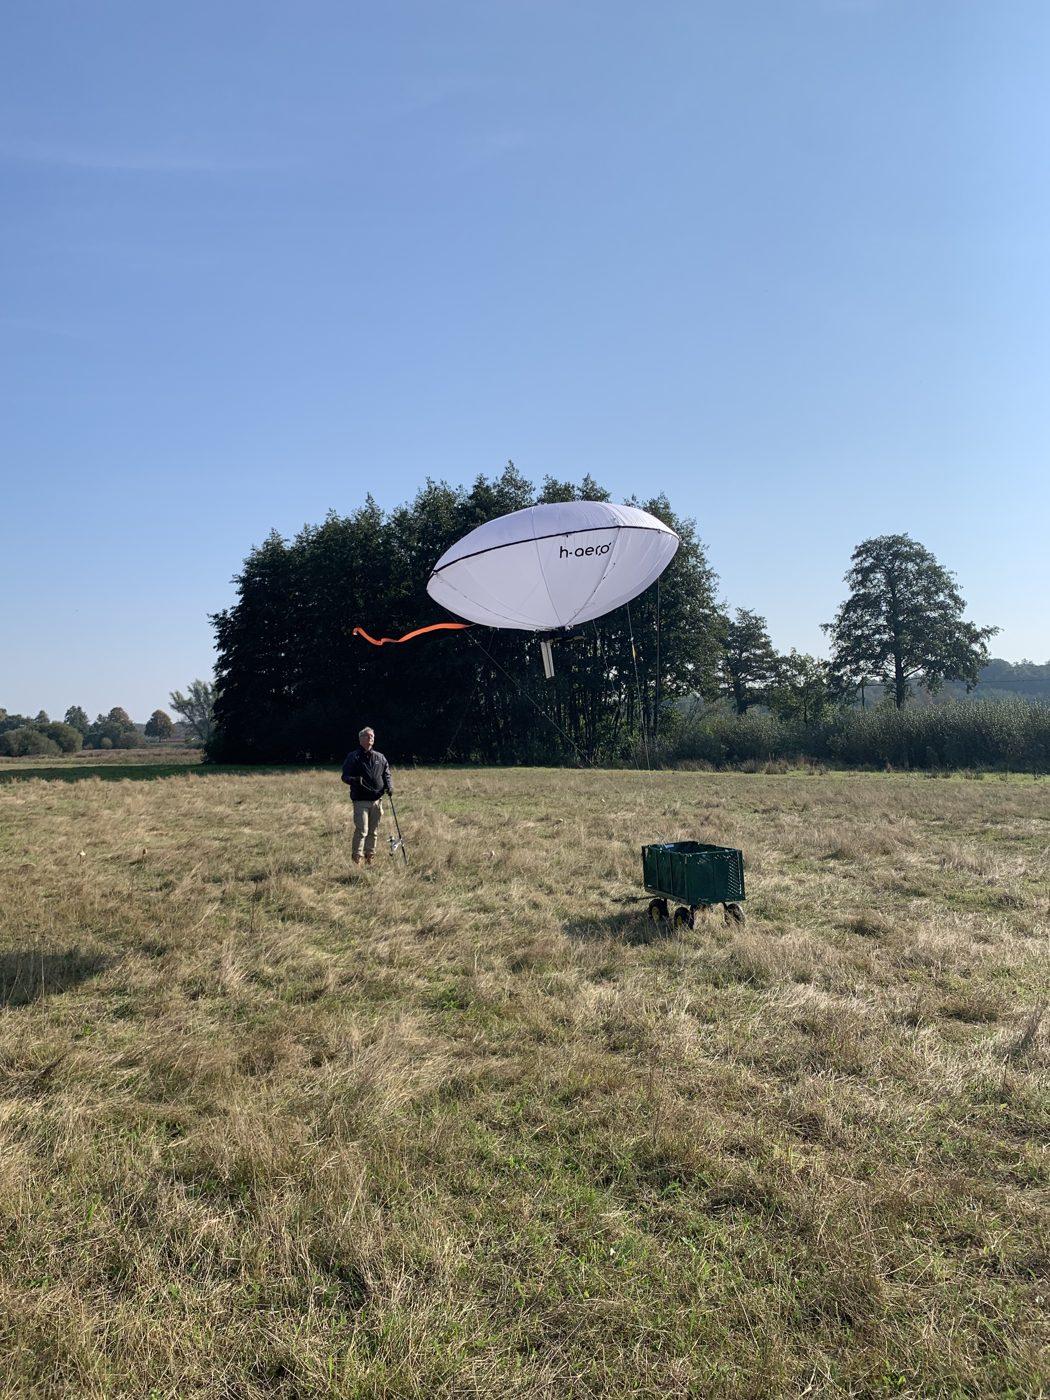
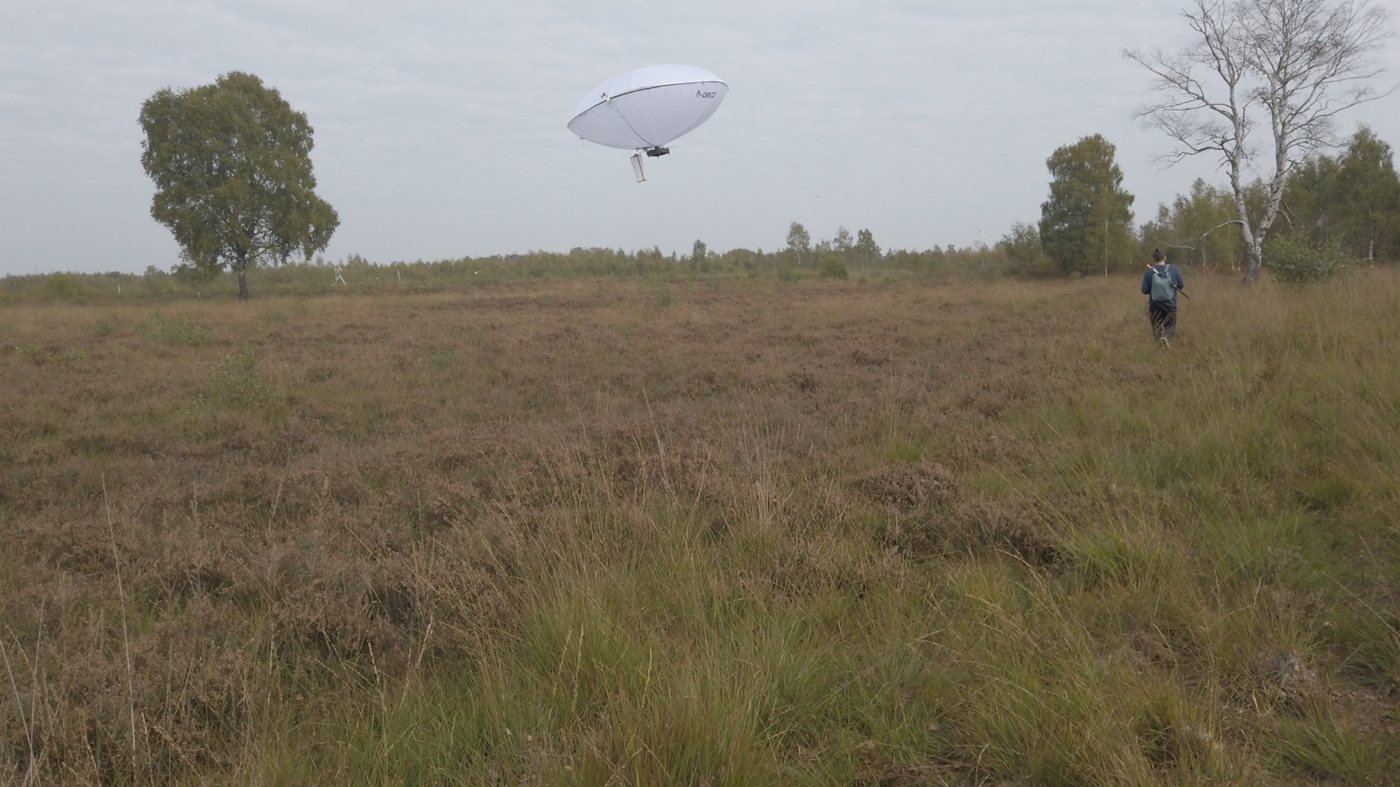
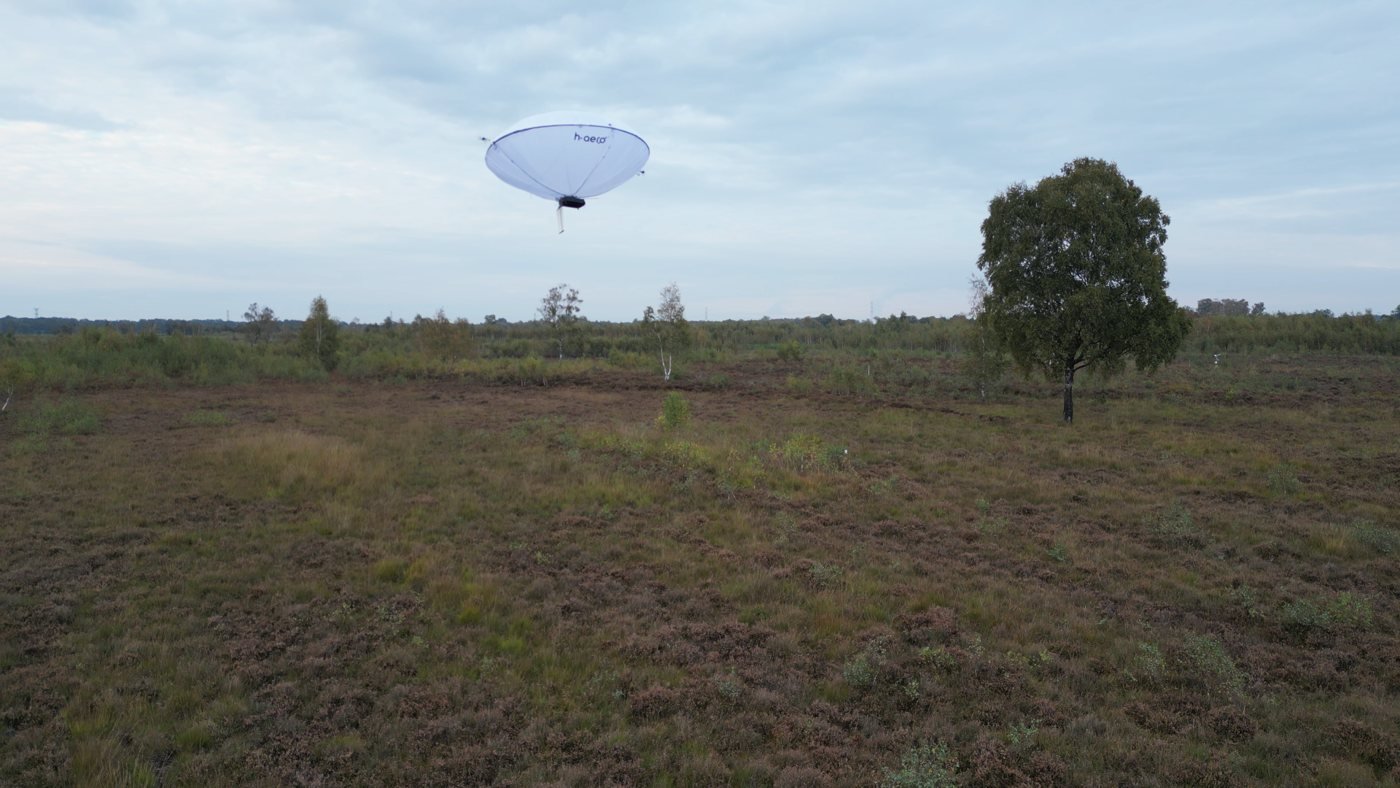
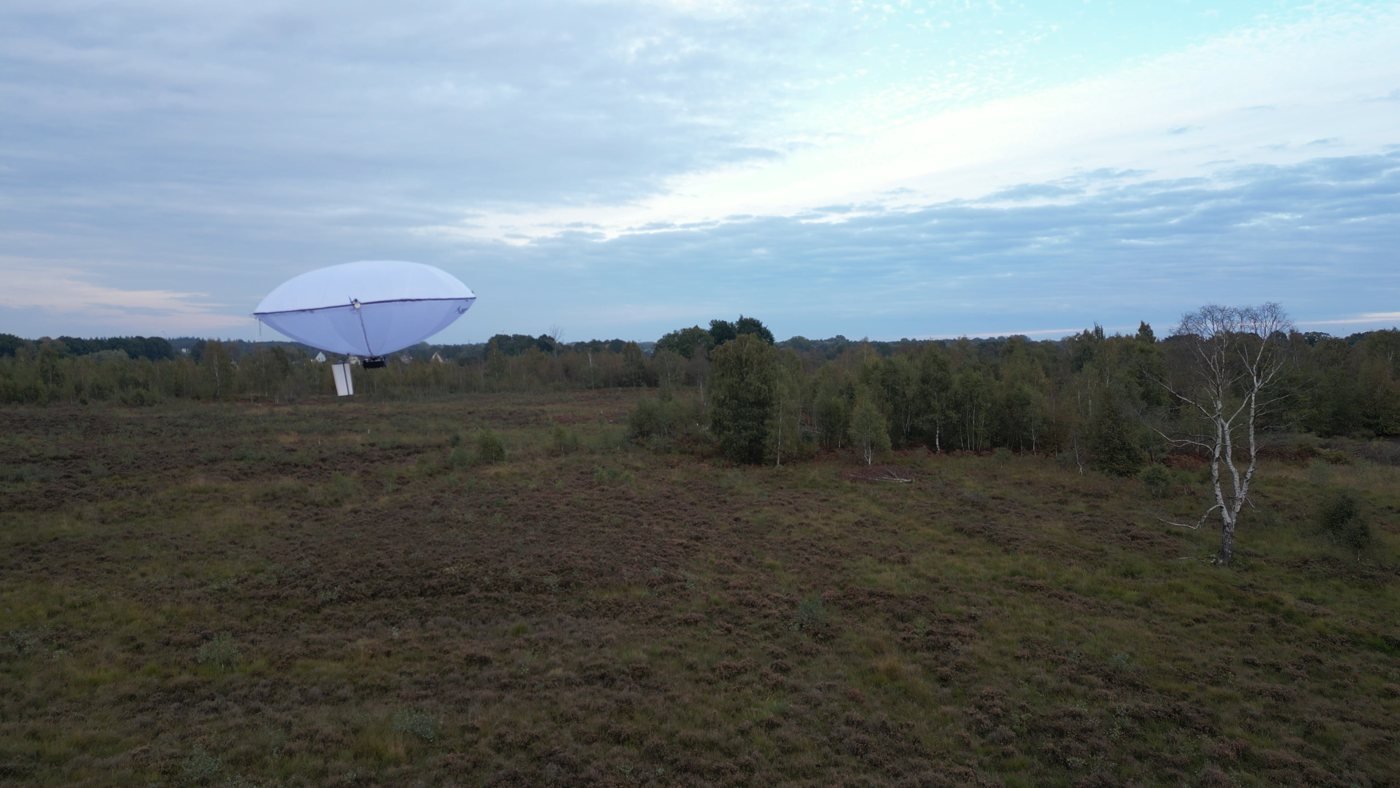
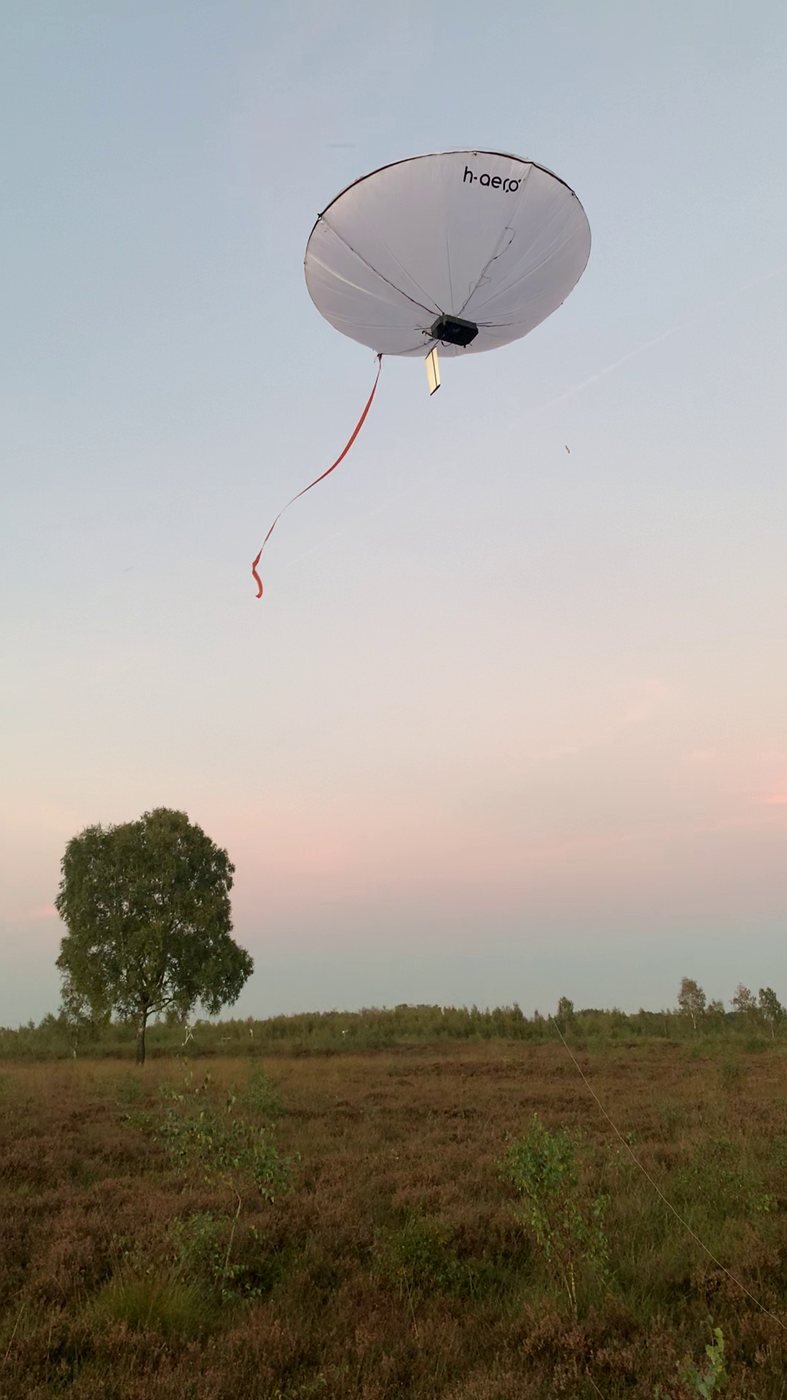
Over the peatland we measure greenhouse gases (CH₄, CO₂, N₂O) right above the surface, so the platform deliberately flies only a few metres up here. Tethered, guided and free flight: the same platform that also flies over forests — here on measurement duty in autumn 2026.
Data product
During the flight, the readings appear on the map — as maximum, trace, time average and measurement coverage, together with a moving map showing envelope, shadow and ground projection. The demonstration below uses real flight paths and altitudes; the gas values in it are simulated.
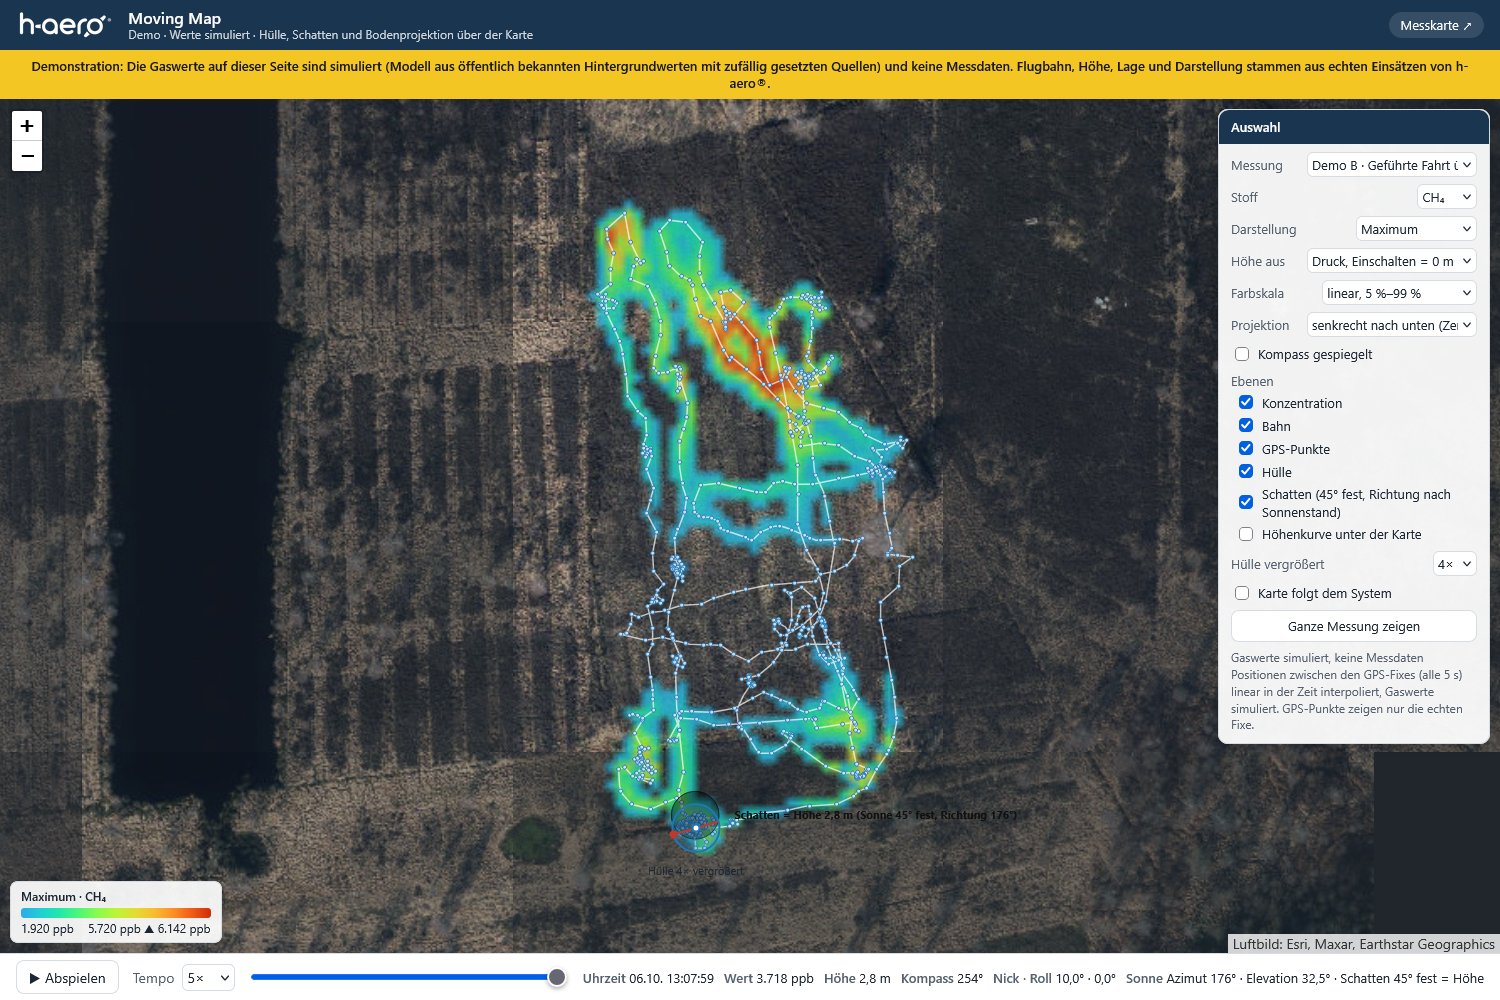
Demonstration: simulated values, not measurement data.
Next step
Get to know the platform at a free demo in Baden-Baden, or talk to us about greenhouse-gas monitoring over your peatland.